Our dashboard is the first you will see after creating your account with us and it is also the page you will see most regularly. On the dashboard you can find an ordered overview of all your sites and have lots of important controls for each of them right below your fingertips. This page will give you the details of what you can do with our dashboard.
1. Add A New Website
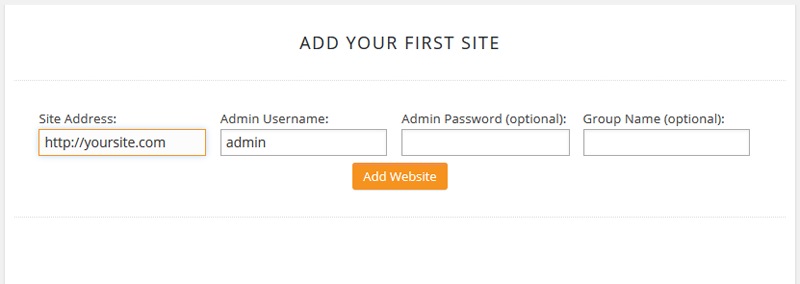
At the top of the dashboard you can find a link to add a new website directly in your dashboard. Clicking the link pops up a box containing the add site form. Enter your website URL and admin username and press the “Add Website” button to include the site in CMS Commander. To add several websites in bulk or to delete website you need to go to the “Your Sites” page – see our article for details.
2. Manage and Delete Websites
After adding your first website a new “Settings” tab button appears at the top of your dashboard, which allows you to manage your sites and your CMS Commander configuration.
After clicking on the button you get to a page with 5 links that allow you to do the following:
- Delete sites from your account as well as edit the groups of your sites or reinstall the CMS Commander client plugin.
- Set up uptime monitoring for your account.
- Apply custom client plugin branding to your sites in order to white-label CMS Commander and hide it from your clients.
- Set up automatic plugin, theme and WP updates on your sites.
- Connect your Dropbox, Google Drive and Google Analytics accounts to CMS Commander.

3. Reviewing And Managing Your Websites
All sites you have added to CMS Commander are displayed in a big table, with one weblog per line. For each website there are several rows alerting you of important information regarding the weblog or of necessary actions you need to take, like installing updates or improving comments.
Below is how a fully configured dashboard will look. Hovering over each table cell will bring up a popup with additional information or actions you can perform.
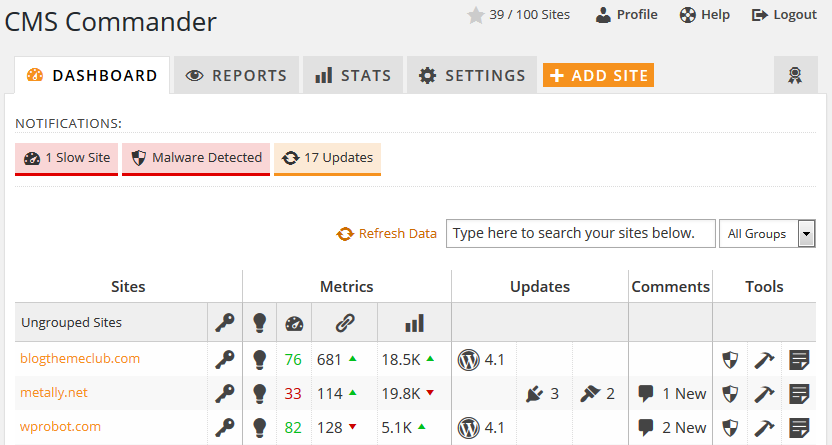
From left to right you can find the following information or perform the following actions in each of the columns:
- Site URL – click the link to open your website in a new window. When hovering over the name a popul will open that allows you to delete the website from CMS Commander or set it as your default site.
- Instant Login – click the key icon to go to your WP-admin directly.
- Uptime Monitor – the lamp icon displays in green if your site is online or red if your site is offline. Hover over the icon to display details. For this row you need to activate Uptimerobot integration (see below)
- PageSpeed – this colorful value shows your sites Google PageSpeed score. A green value means your site loads fast while red indicates a slow site. Hover over the value for more details.
- Backlinks – a report of the backlinks pointing to your site as reported by SEMrush.
- Traffic Statistics – shows the site traffic over the last week as reported by Google Analytics. Hover over the icon to see more detailed stats. For this row you need to activate Google Analytics integration (see below)
- WordPress Updates – shows a button if a new WP Core version is available. Hover over the button to view details and click the button to install the new WordPress version on your website.
- Plugin Updates – shows a button if a new version is available for one or several of your plugins. Hover over the button to view details and click the button to install the new plugin versions on your website.
- Theme Updates – shows a button if a new version is available for one or several of your themes. Hover over the button to view details and click the button to install the new theme versions on your website.
- Comments – shows a button if there are new comments. Hover over the button to view, delete, approve and reply to the comments. Bulk actions to empty the comments trash and spam are also offered in the popup.
- Backups – Hover over the icon to see recent backups performed for your sites by the tasks you have set up in CMS Commander.
- Maintenance Mode – click the button to put your website into maintenance mode instantly. A site in maintenance mode will show the button in red and can be clicked again to remove maintenance mode.
- Notes – hover the icon to display and write notes for your website. An orange icon means there are saved notes, otherwise the icon is grey.
At the top of each row you can find darker buttons to perform bulk actions on all your websites at once. If you want to perform a bulk action on specific sites only you can select those with the filtering options explained above. The bulk actions make it possible from left to right to:
- Login to multiple sites’ WordPress admin areas (with the key icon).
- View aggregated traffic statistics for all your websites together by hovering over the stats icon.
- Update the WordPress core to the latest version on multiple websites.
- Update all plugins on multiple websites
- Update all themes on multiple websites
- Delete or approve all new comments on multiple WordPress websites
Almost all buttons on your dashboard display additional information or actions when you point your mouse over them. For example the “X New” comments button allows you to review, delete and approve the new comments.
Filtering Sites
At the top right of your site table is a search form that allows you to filter your sites and search for specific blogs. As soon as you start typing inside the form area all the sites that do not match your entered search term will disappear, allowing you to quickly locate specific sites if you are managing a large number of them.
Notification Bar
Located at the very top of the dashboard page the notification bar will alert you of available updates or important warnings regarding your sites. Hovering over a notification will bring up a popup with additional details.
The following notifications will be reported. Please note that some of them require additional setup. For example for the uptime notification to work you first need to configure UptimeRobot integration in your CMS Commander account (see below).
- Updates Available: This notification displays if plugin, theme or core updates are available for your sites and allows you to install them all with one click.
- CMS Commander Update: Allows you to install a new version of the CMS Commander client plugin to all your sites with one click.
- Clean Up: Allows you to optimize your site’s database and clean trash comments in bulk to free space.
- Sites Offline: This warning shows up if one or more of your sites are reported offline by UptimeRobot.
- Malware Warning: If malware was found on one of your sites you will see this notification.
- Traffic Warning: Will show up if Google Analytics reports that your traffic was at least 50% lower than in the previous period.
- Slow Sites: If CMS Commander detects PageSpeed scores of under 40 for one or more of your sites this warning will notify you.
4. Enabling All Features Of The Dashboard
For two rows in the dashboard additional setup steps are necessary until they are displayed:
- To show traffic stats you need to connect your Google Analytics account to CMS Commander. To do so click the “Settings” tab at the top of the dashboard page.
- To show uptime reports you need to enter your free uptimerobot.com account in CMS Commander. To do so click the “Your Sites” tab on the page and follow the instructions.
5. Network Stats Widget

Below the dark table listing your sites you will find the network stats graphic. To use this feature you first need to connect your Google Analytics account to CMS Commander, by clicking the “Settings” link at the top of the dashboard page. After that a big graphic will be displayed showing the aggregated traffic statistics of all your websites during the last 2 weeks. With the menu at the top of the graphic you can display the statistics for specific websites or groups of websites, change the displayed metric and the graph type.
Join Over 3,000 Other Commanders!
Sign up now to start managing all your blogs immediately.
Completely free for 30 days. No payment details required!